USAGE
FACTOR, QUEUING THEORY BASICS AS IT APPLIES TO SYSTEM PERFORMANCE.
In this write up I have tried to give a very basic overview of queuing
theory concepts, as it applies to system performance.
Queuing Theory is a set of mathematical solutions to waiting line or
process type problems. In these problems, there is some process which
consumes time, units arrive in the system, and are processed though
it.

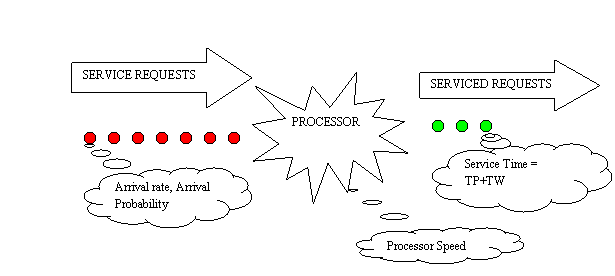
A simple queue can be thought of as a set of requests that need
servicing arriving at a particular rate with a particular probability
of arrival (red dots). A processor that services the request at a
particular speed and serviced requests (green dots).
The arrival rate and the probability determine the
input queue length at any given time. For further reading you can try a
google search on queuing theory.
What we are interested in, is the Total elapsed time which is
the
sum of queue wait time and the request processing time. For
the sake of simplicity let us assume that all the arriving
requests are of equal complexity, which means that each request takes
the same time to process when it is the only request to be processed.
In most real life situations the processor is shared among requesters.
( Only a few tellers for a queue of customers at the bank, Only one CPU
complex for thousands of SQL request, Only One VSAM dataset on a disk
for thousands of SQL on that table).
The questions most of us would like to answer are ,
If one SQL when run by itself takes "m" milliseconds to run , how long
will 5000 requests take to run?
Is it 5000 x "m" milliseconds? If so how long will 10000 SQLs take?
Definitely it is not 10000 x "m" milliseconds. Or is it? Is there a
point at which your processor becomes overwhelmed and simply
breaks down? If so, where is that point? How many
SQLs can I run concurrently with out reaching the point of melt down?
etc.
To understand and answer business critical questions like these, one
needs to have at least a basic understanding of resource usage
factor, how it affects service times etc.
Usage factor U , very simply put is
the ratio of the current usage of a resource to it's maximum available
usage.
A 100 GB disk which has 60 GB data in it has a usage factor of
0.6 .
A 1000 MIPS CPU complex which has applications running on it that
consume 750 MIPS has a usage factor of 0.75.
A Truck that can carry 5000 Kg with a maximum axle rating of
10000 Kg has a usage factor of 0.5.
In our queue example, if the processor has a capacity to service 1000
requests per second and if it has 1000 requests every second to
process it has a usage factor of 1.0
Understanding the effect on usage factor is key in estimating the point
of melt down.
Total Elapsed time = Total Queue Wait time + Actual Request
Service time
Request Service time = ( Ideal
Request Service time x Usage factor ) / (1 - Usage factor )
where 0>= Usage factor >= 1
The Request Service time is proportional to U/(1-U).
When we invest in infrastructure we want to get the maximum return on
our investment. Naturally, we are tempted to use the resource close to
it's maximum rated capacity. Or a usage factor of close to 1.
Let us look at what happens to service time as we approach a usage
factor of 1 . U/(1-U) approaches 1/(1-1) which is 1/0 .
Therefore as U ==> 1 , U/1-U ==> Infinity .
Hence your service time also approaches infinity.

As you can see from the simple plot above as U reaches 0.95 you
are fast approaching the meltdown point.
As U gets closer to .95 the Service time of the system reacts
violently and starts approaching infinity.
The "system" might be your CPU , DISK, Network, employee or
your motor car.
It is just a bad idea to push the average resource utilization factor
beyond 0.9, and the peak resource utilization factor beyond 0.95.
The next time some one in your company tells you to use a DASD volume
to it's full capacity or gives you just enough buffers for your
requirement think about the meltdown point where U approaches unity.

